Deviation Detection
What You Designed vs What Got Built
Every project has hidden deviations. Most go undetected until it's too late.
COMPARISON MODE
Al-Riyadh Commercial Tower
12 Deviations Found
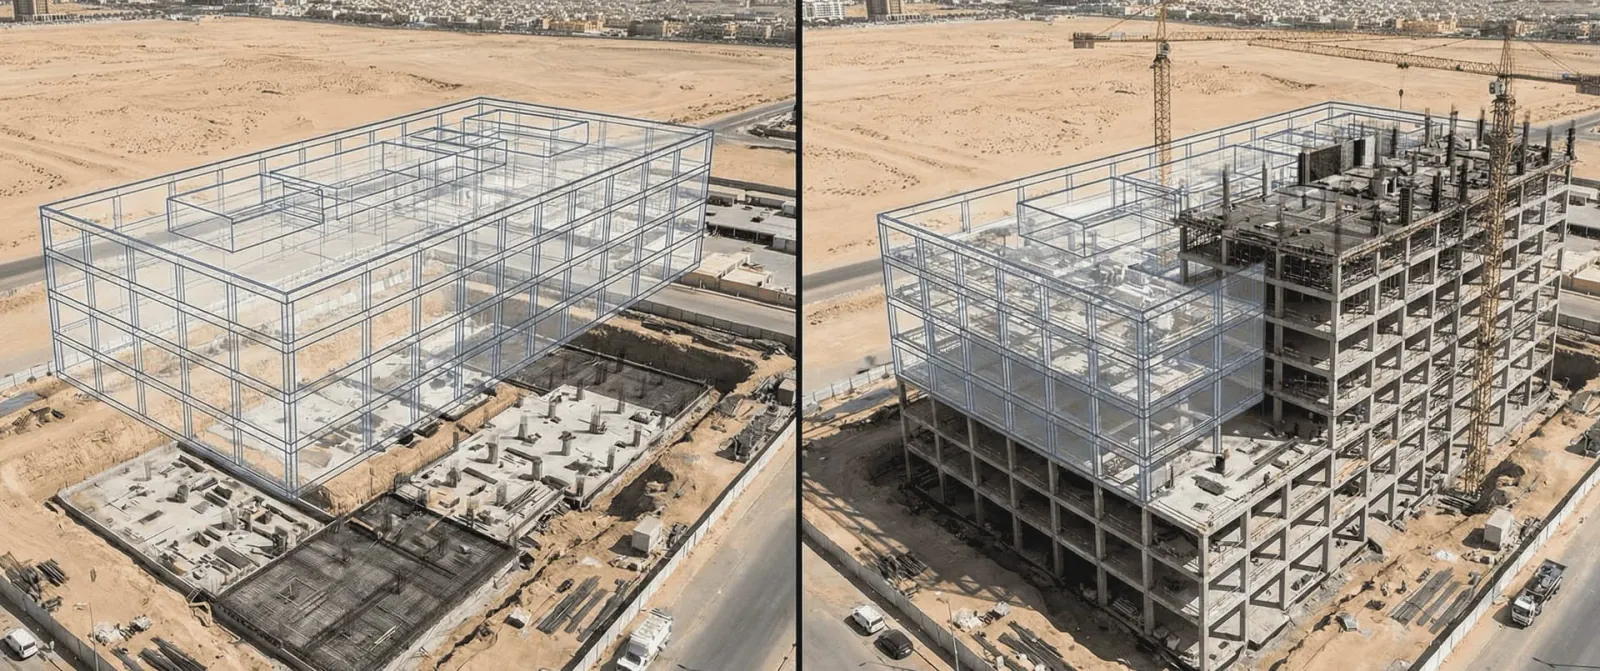
BIM DESIGN
AS-BUILT
SAR 847K Avg. Rework Cost
23% Projects with Major Deviations
67 Days Avg. Delay from Issues
Reveal the gap